Mastering the Map: A Strategic Guide to the Provincial Tender Heatmap 2026
Turn data into destiny. Learn how to master the Provincial Tender Heatmap to identify market gaps, optimize your bidding budget, and dominate South African procurement in 2026.
Knowledge is power, but in the fast-paced world of 2026 South African procurement, visualized knowledge is the ultimate advantage. As the volume of government tenders continues to grow, businesses are finding themselves overwhelmed by the sheer amount of information they must process. The Provincial Tender Heatmap was designed to solve this exact problem. By transforming thousands of data points into a single, intuitive visual interface, it allows business owners to see the 'big picture' of national procurement in seconds. This isn't just a map; it's a strategic weapon for any business serious about winning government contracts.
For many SMMEs, the tender process often feels like playing a game where the rules are constantly changing and the board is hidden from view. The heatmap changes that dynamic. It shines a light on the geographic and sectoral trends that define South African government spending, revealing the hidden patterns that dictate success or failure. In this comprehensive guide, we will walk you through the core features of the heatmap and show you how to integrate this powerful tool into your daily business development workflow to maximize your win rates and optimize your growth.
Understanding the Heat: What the Colors Mean
At its heart, the Provincial Tender Heatmap uses color intensity to represent 'tender density'—the volume of active tenders relative to a province’s typical activity and market size. But many users make the mistake of only looking for the 'hottest' (darkest) areas. While dark colors indicate high volume, they also signal high competition. The true strategic value lies in understanding the gradient of the map.
A province shown in a 'medium-heat' color often represents the 'Sweet Spot' for SMMEs. It indicates a significant volume of tenders—enough to sustain multiple business units—but without the crushing competitive pressure found in the national economic hubs. By monitoring the color shifts over time, you can also identify 'emerging markets.' If a province moves from cool to medium heat over a few weeks, it indicates a new budget cycle has just been unlocked. This is your signal to get your compliance documents in order and start looking for local partners.
The Category Filter: Precision Targeting
Tender density by province is only half the story. To truly unlock the tool's power, you must use the 'Category Filter.' This feature allows you to see the heatmap through the lens of your specific industry. A business specializing in 'Waste Management' doesn't care that Gauteng has 600 active tenders if 500 of them are in ICT. They care where the 'Waste Management' tenders are.
By filtering the map for your specific category, you might discover that while the national volume for your sector is low, it is highly concentrated in a specific province. For example, 'Renewable Energy' tenders might be sparsely distributed nationwide but show a deep intensity in the Northern Cape. This sectoral visualization tells you exactly where to focus your marketing, where to build your supply chain, and where to establish your regional footprint. It moves you from generic bidding to precision-targeted growth.
Step-by-Step: Your Weekly Heatmap Workflow
To get the most out of the heatmap, we recommend a disciplined, weekly routine. Data-driven success isn't built on a single flash of insight; it's built on consistent monitoring and strategic adjustment.
Step 1: The Monday Morning Scan
Start your week by scanning the national map. Look for any major shifts since last week. Are there any provinces that have significantly darkened? This is your early-warning system for new provincial growth programs. Note these areas for deeper investigation later in the week.
Step 2: Category Deep-Dive
Apply your industry filters. Is the 'heat' in your sector moving geographically? For example, if you are in 'Infrastructure,' you might notice the focus shifting from urban metro upgrades to rural road maintenance. This shift should dictate which of your project managers you prioritize and which B-BBEE affidavits you need to renew.
Step 3: Intensity vs. Competition Analysis
Identify your 'Target Zones' for the week. These are provinces where the heat is medium-to-high but where you know your specific B-BBEE profile or local partnerships give you an edge. Use the heatmap alongside our 'Competition Analytics' tools to see who the incumbent suppliers are in those regions.
Step 4: Readiness Check
Once you've identified a Target Zone, run a 'Readiness Assessment' specifically for that province. Do you have the necessary regional registrations? Do your local content numbers meet the provincial requirements? By doing this before you bid, you ensure that you only invest effort in tenders you are actually qualified to win.
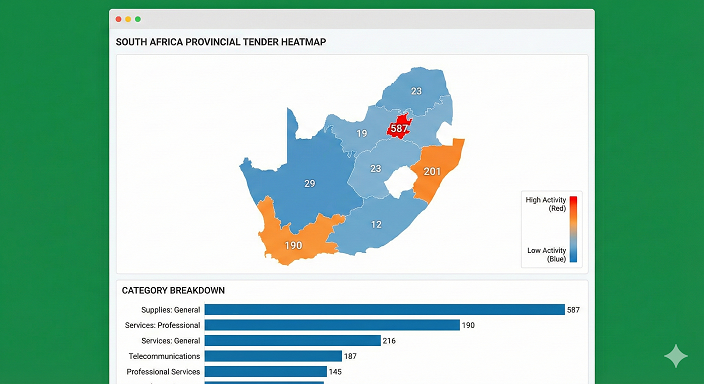
Figure 1: The Provincial Tender Heatmap interface, showing the interactive province selection and category filtering options.
Case Study: The Pivot to Success
A mid-sized professional services firm was struggling to win contracts in the highly competitive Johannesburg metro. Their win rate had dropped to below 5%, and the cost of bidding was becoming unsustainable. After integrating the Provincial Tender Heatmap into their strategy, they noticed a persistent 'medium-heat' zone for 'Management Services' in the Eastern Cape.
Instead of continuing to fight for Gauteng contracts, they pivoted. They identified three municipalities in the Eastern Cape that were consistently issuing tenders for institutional capacity building. They partnered with a local East London firm to boost their local content score and focused their entire Q3 bidding budget on that specific region. The result? Their win rate jumped to 30%, they secured two three-year contracts, and they became the province's 'preferred partner' for institutional reform. This pivot, guided entirely by heatmap data, saved the company from closure.
Summary Table: Heatmap Interpretation Guide
| Map Signal | Market Interpretation | Recommended Action | Risks to Consider |
|---|---|---|---|
| Deep Red/Dark Intensity | Hyper-Active Market | Niche bidding; avoid generic subs | Extreme competition; low margins |
| Medium/Amber Intensity | Healthy Growth Market | Primary Target; Focus on local content | Requires regional partners |
| Light/Cool Intensity | Emerging or Underserved | Monitor for shifts; research gaps | Lower total contract values |
| Sudden Heat Surge | New Budget Cycle/Program | Immediate Readiness Check; mobilizing | Tight deadlines; fast response needed |
Pro-Tip: Historical Pattern Recognition
Don't just look at today's map. Toggle the 'Historical View' to see how the heat has moved over the last 12 months. This often reveals 'Budget Flashpoints'—municipalities that consistently release tenders at the end of the fiscal year (March) or the start of the provincial cycle (July). Identifying these patterns allows you to build your 'Tender Buffer'—cash and resources set aside specifically for these high-volume months.
Conclusion: Navigating the Future of Procurement
In 2026, the complexity of the South African procurement landscape will only increase. New regulations, shifting provincial priorities, and the constant evolution of B-BBEE requirements mean that businesses can no longer afford to operate on instinct alone. The Provincial Tender Heatmap is your most powerful ally in this journey. It provides the clarity you need to make fast, accurate decisions, and the strategic depth needed to build a sustainable, national business.
By mastering the map, you aren't just finding tenders; you are finding your business's future. You are identifying the markets where you can lead, the partners you can grow with, and the communities you can serve. At Tenders-SA.org, our mission is to provide you with the data, the tools, and the insights to turn every bid into a win. The heatmap is live, the data is updating, and South Africa's procurement landscape is yours to explore.
Visit the Provincial Tender Heatmap today. Filter by your sector. Analyze the trends. Build your strategy. Your journey toward procurement mastery begins with a single click.
Tags
Based on this article's topics, here are some current tenders that might interest you
Appointment of a service provider support the MQA with public relations services utilising media and communication tools and communication tools and platforms to plan and oversee public relations activities ensuring effective communication with all MQA stakeholders for a period of three years
Appointment of a service provider support the MQA with public relations services utilising media and communication tools and communication tools and platforms to plan and oversee public relations activities ensuring effective communication with all MQA stakeholders for a period of three years
PANEL OF FIVE (5) SERVICE PROVIDERS FOR SUPPLY AND DELIVERY OF TRANSFORMERS, MINI SUBSTATIONS, SWITCHGEAR, TOOLS, AND ASSOCIATED ELECTRICAL EQUIPMENT AS AND WHEN REQUIRED FOR A PERIOD OF 36 MONTHS
Request for Supply and Delivery of PAT Materials to appropriate workshop clothing to Technical, Comprehensive and Agricultural Schools: Lot1 - Supply, delivery and installation of Equipment and Tools for Civil, Electrical, Mechanical Technology Specialisations and Engineering Graphics and Design (EGD): Lot2 - Supply and Delivery of Practical Assessment Task (PAT) Materials to Technical, Comprehensive and Agricultural Schools: Lot3 - Supply and Delivery of Personal Protective Clothing for Teachers to Technical and Comprehensive Schools in the Free State for the period of Three Financial Years from the date of approval
AUTOMATED TESTING, PERFORMANCE TESTING, AND SOFTWARE QUALITY ASSURANCE TOOLS.
APPOINTMENT OF A PANEL OF THREE (03) SERVICE PROVIDERS FOR SUPPLY, DELIVERY AND OFF-LOADING OF BUILDING MATERIALS AND TOOLS FOR A PERIOD OF THREE YEARS AS AND WHEN THE NEED ARISES
Want to see all available tenders?
Browse All Tenders →Share this article
Mastering the Map: A Strategic Guide to the Provincial Tender Heatmap 2026
Turn data into destiny. Learn how to master the Provincial Tender Heatmap to identify market gaps, optimize your bidding budget, and dominate South African procurement in 2026.